More on ongoing and expected sea-level rise in various US cities here.
http://mashable.com/2014/12/20/washington-dc-sea-level-rise/
More on ongoing and expected sea-level rise in various US cities here.
http://mashable.com/2014/12/20/washington-dc-sea-level-rise/
I have a burning climate science communications question for the Climate Etc. readership: How do you embed a JPG, a PNG, or a GIF image inside of a comment?
The government of DC is overrun with democrats as anyone viewing over the beltway knows and this is typical of their stupidity (it just might be endemic to the area and democrats are just more affected).
DC is about 150 feet over sea level. The locals are aware that the Potomac flows downhill which means they aren’t at sea level.
There is no combination of awful outcomes short of an asteroid strike that would cause a “sea level” problem for DC. If you did melt all the ice on the planet (the glacial isostatic adjustment or rebound, would mitigate much of the sea level rise – but we’ll ignore that) they might – just might have cause for concern. But 6-10 inches isn’t going to threaten the city.
Paste the URL ending in JPG or PNG into your message, e.g., this should work.
![]()
That’s a pretty dense thought process even for you Max:
How many trillions printed to achieve a lame recovery by every historic measure??
Hmmm … a silver lining for a cold climate. What will we do for politicians if that happens?
Dr Curry,
I found your link to “Arctic sea ice may be more resilient than many observers recognize” quite a bit misleading. If one actually reads the article they find:
“spacecraft observed 7,500 cu km of ice cover in October when the Arctic traditionally starts its post-summer freeze-up. This was only slightly down on 2013 when 8,800 cu km were recorded.”
So its basically saying that the ice cover this Oct was slightly LESS than lat Oct. And everyone knows that 2012 was the all-time record late summer low in Arctic ice cover.
The article confirms that: “the ice is still much reduced compared with the 20,000 cu km that used to stick around in the Octobers of the early 1980s” .
Then the author (likely a non-scientist) makes a bizarre assertion:
” there is no evidence to indicate a collapse is imminent.”
Well, no one is saying that total collapse is imminent by say next year, but being down over 60% from levels just 3 decades a go is huge. Even the researcher later in the article concludes that the slight rise from 2012 levels may be just a temporary thing:
“So, what may be occurring here is a decline that looks a bit like a sawtooth, where we can lose volume but then recover some of it if there happens to be a shorter melt season one year,”
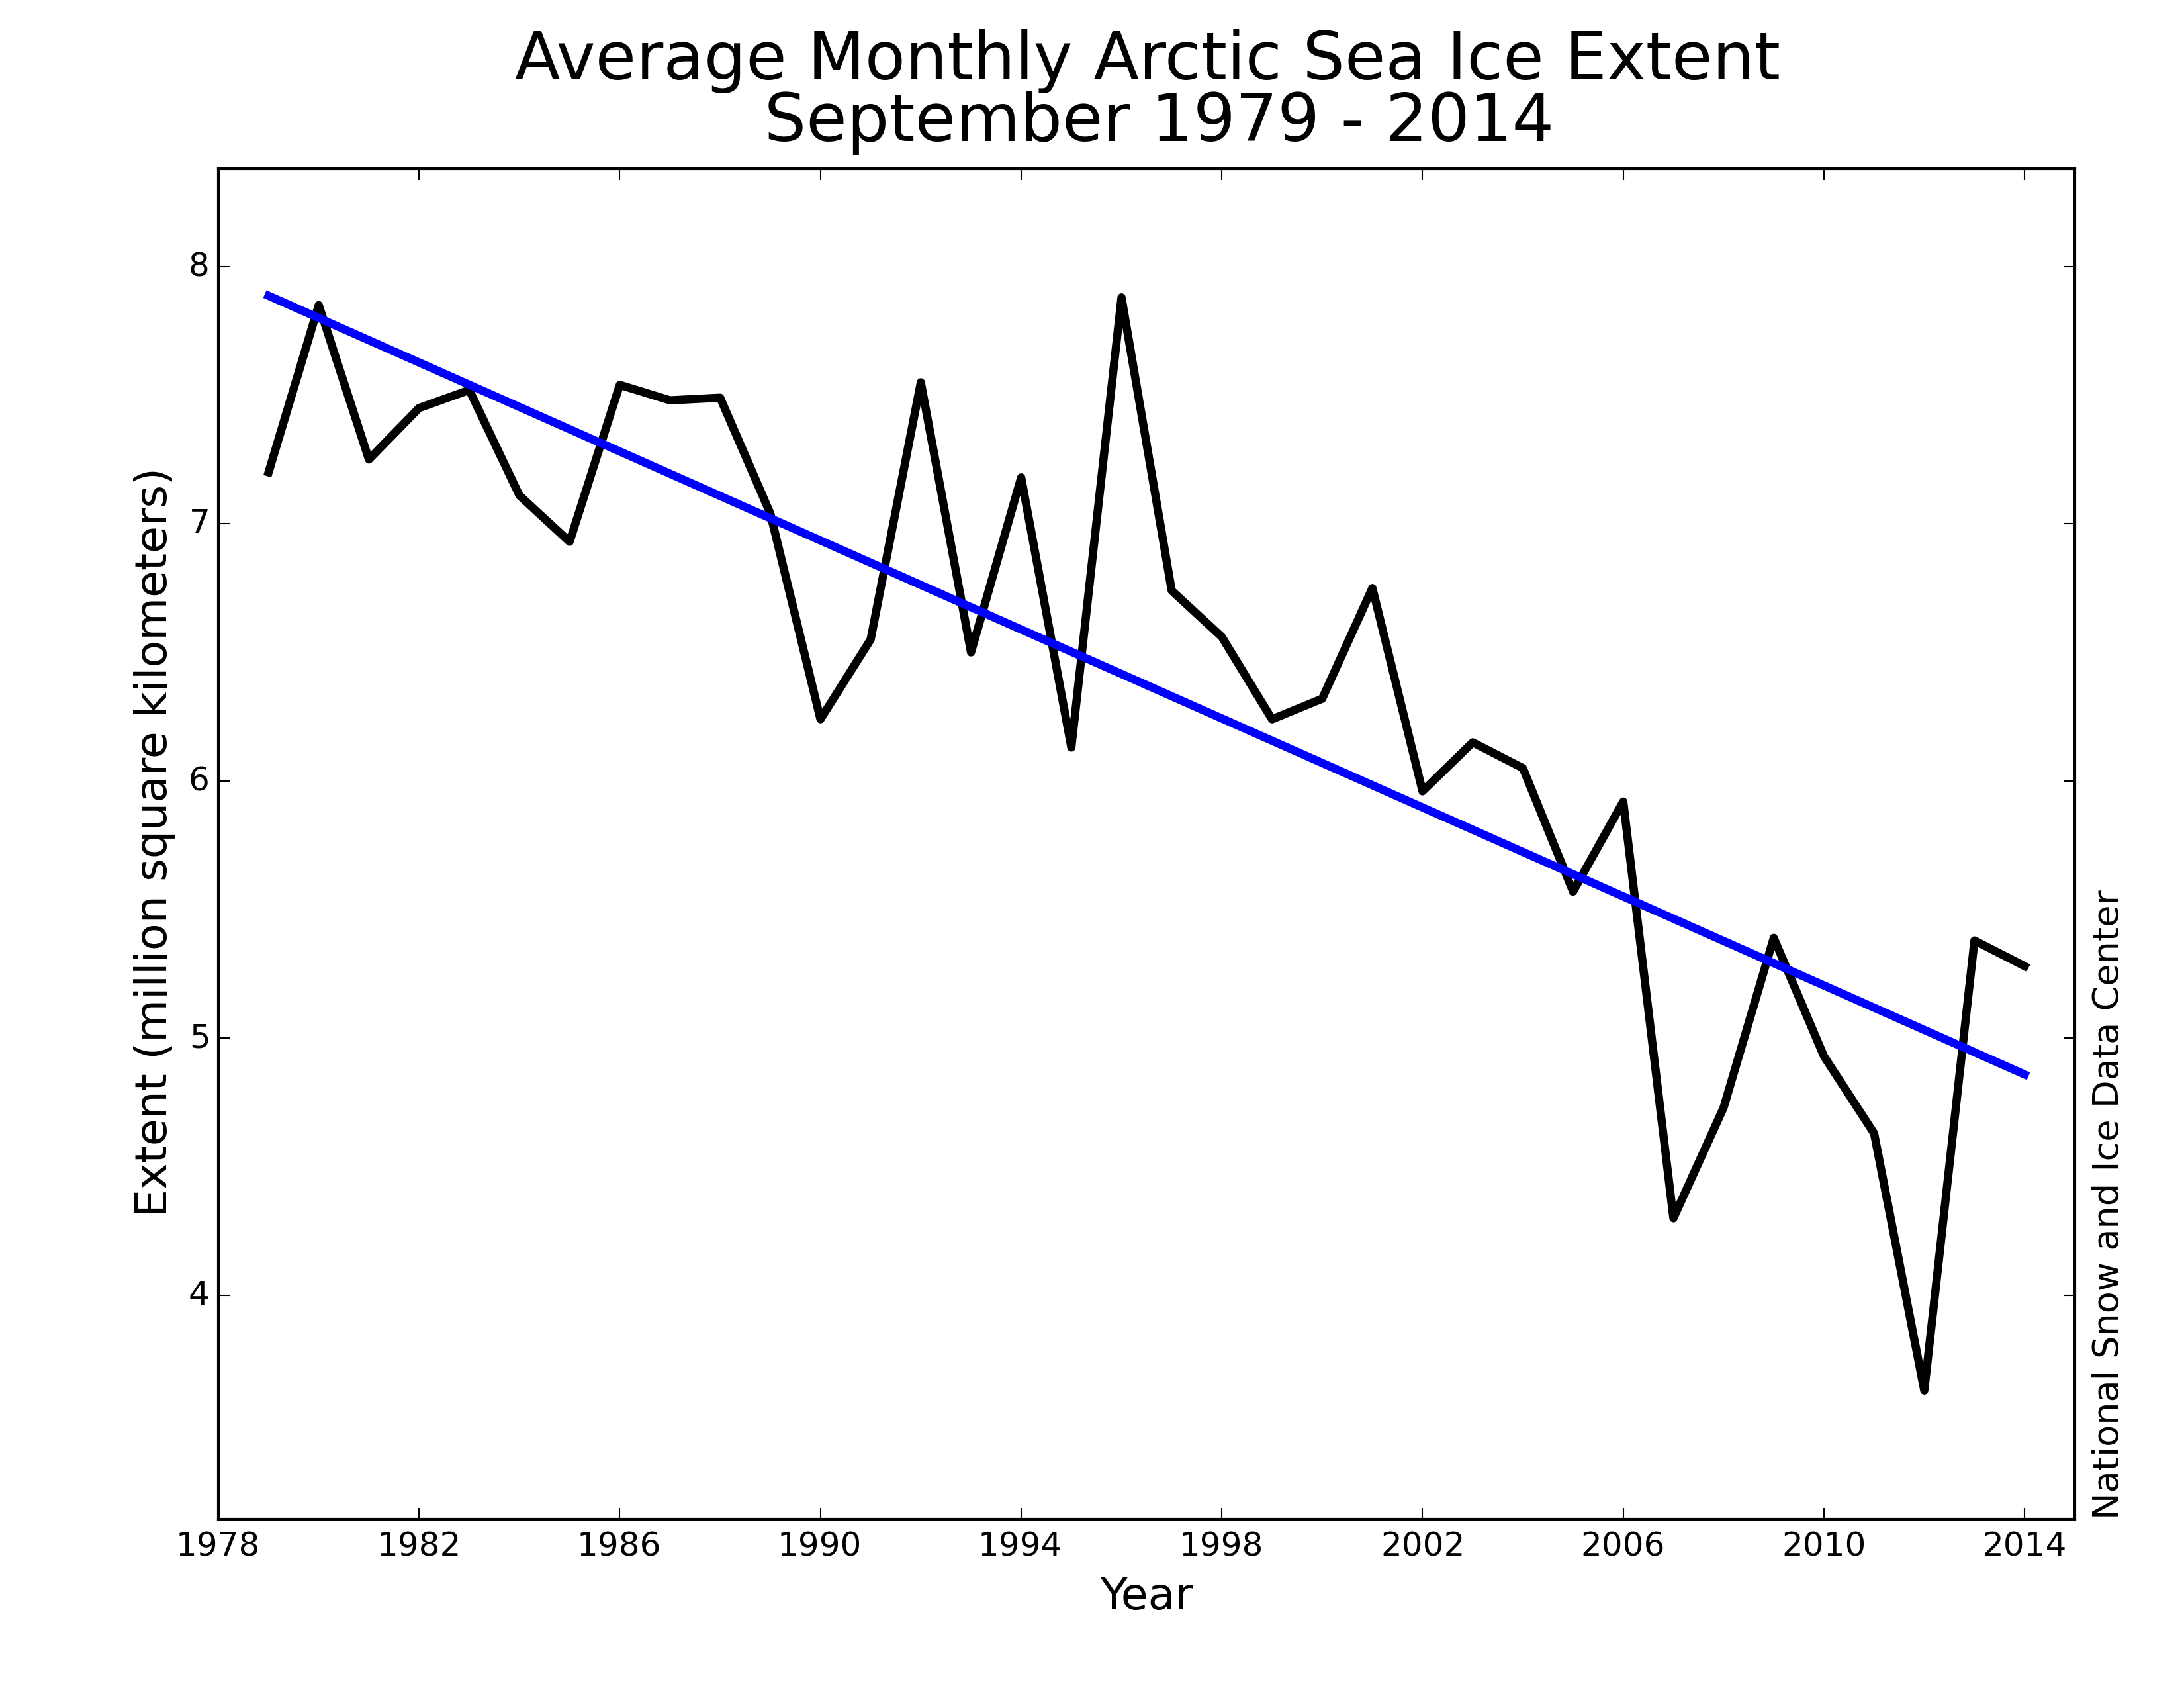
Here is the latest late Summer Arctic Ice Chart thru 2014:

Anyone claiming there is no issue with shrinking Arctic ice, you’ll only have a shred of scientific support when Ice cover levels get back to 1980’s levels.
Basil
Here is the extended version of my article on arctic sea ice levels from 1920 to 1950
http://wattsupwiththat.com/2014/08/22/historic-variations-in-arctic-sea-ice-part-two/
It contains hundreds of references many of them from contemporary scientists from that era.
Arctic ice levels were at a high point in the 1970’s when satellites first started recording. Ice levels in the 1920 to 1940 period were similar to today.
The highest temperature in Greenland for two consecutive decades remains the 1930 to 1949 period.
The northern sea route also opened up allowing the wartime arctic convoys. My next door neighbour, now 91 , was awarded the ushakov medal for his part in it by the Russian ambassador just last Friday.
It was also warm during the 1818 to 1860 period. Also several decades around the mid 1500’s. We are all aware of course of the melting during the arctic period.
The current era is not remarkable for the arctic ice levels
Tonyb
The northern
“It was Charles Dickens who taught the world to reflect, at Christmas-time, upon the amoral realities of efficient markets.”
______
Yep. All your money and profits won’t bring the most important things to your life– and often take you further from them.
“I find that “skeptics” are very resistant when facts on the surface go against their meme”
____
A sure sign they are not skeptics, but simply deniers in every sense of the word.
@ Jim D, tonyb, et al
I noticed the discussion re ice loss from the Greenland ice cap and got curious as to the current ‘state of play’. This was one the first ‘hits':
http://www.arctic.noaa.gov/reportcard/greenland_ice_sheet.html
from which I got these bits:
“A negligible ice mass loss of 6 Gt between June 2013 and June 2014, in contrast to the largest annual loss (474 Gt) observed in the GRACE record in 2012, indicates a slowing of the rate of ice loss.”
“Average albedo during summer 2014 was the second lowest in the period of record that began in 2000; a new record low albedo occurred in August 2014.” (See captdallas2’s comment re soot/black carbon and note that with a record low albedo, the ice loss was also at a near record low rate.)
Taking the data at face value and ignoring the question of whether we can actually measure the Greenland ice cap with +/- 1e(-6) precision, my first reaction is ‘So what?’.
The total mass is around 3e15 tons. If I postulate a rate of loss triple the largest loss observed to date I get a loss of 1e12 tons/year. In other words, the ice cap will be gone in a mere 3000 years. It also corresponds to a volume loss (if triple the max observed rate) of 1000 km^3/year, which translates into a sea level rise rate of 3 mm/year. Again I ask, ‘So what?’. If the sea level rises 1 meter over the next 300 years, is it going to make ANY difference that would cause anyone other than professional sea level recorders to even notice, never mind feel threatened enough to demand the cessation of fossil fuel use? As a separate issue, is there any evidence that if we DID cease the use of fossil fuels that it would have any measurable effect on the rate that the Greenland ice sheet lost mass OR the rate of rise of sea level?
Remember: the above ‘catastrophe’ was predicated on a postulated rate of loss triple the maximum observed loss. At the most recent loss rate, the icecap disappears in somewhere between 400 and 500 thousand years and the Greenland ice cap melt causes the sea to rise at a rate of 0.02 mm/year. And I should give up electricity at the flip of a switch, 24/7/365 and the freedom to ‘move about the country at will’ in my car on the off chance that doing so would prevent my hundredth to ten thousandth generation descendants from enjoying their wine tasting tours of the famed Greenland vineyards?
Yes there flows and currents in the Arctic Ocean and the ice does move in that 2013 example, like it does in most other years.
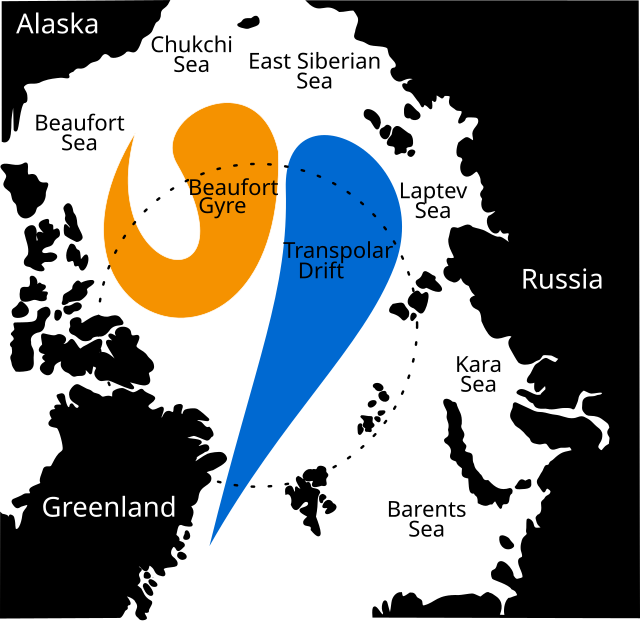
But how does that explain the past 35 years? Because it (fluid dynamics) doesn’t..
There is no proof of any anomalous Arctic current over the past few decades. Sorry, the main answer is THERMODYNAMICS.

‘The impacts of AO on North American weather can affect our daily lives, but climate scientists want to know how the AO influences sea ice conditions in the Arctic Ocean. While over the long term, sea ice extent has been declining, during any particular winter extent can vary due to weather conditions. Meier said, “The Arctic Oscillation primarily affects sea ice through winds that cause changes in where the sea ice drifts.” When the Arctic Oscillation is in its negative mode, he said, the winds and ice tend to flow in a clockwise direction, generally keeping more of the older, thicker ice in the middle of the Arctic. In the positive phase, that old ice tends to get pushed out of the Arctic along the Greenland coast. Meier said, “This means that the sea ice tends to be younger and thinner and more prone to melt after a winter with a strong positive Arctic Oscillation.” The AO is just one of many weather wildcards that could spell the difference between a low sea ice year and a record low year.
http://nsidc.org/icelights/2012/02/02/the-arctic-oscillation-winter-storms-and-sea-ice/
The AO turned negative after 1995.
Ice has multidecadal trends.

So does the AO.

As does Arctic temps.

Unless ya got a handle on natural variability – ya got nothin’.
PA, we can resume later, but it so far looks like a classic case of ABCD, unless you show a bottom-up approach that explains the last billion years of paleoclimate without a CO2 driver.
Basil
It is Christmas Eve morning over here so you will appreciate I have better things to do than continually check up on the doings of this blog, especially as the nesting seems to be all over the place due to deletion of other comments.
I suggested you were being selective and did not read the context of the material I presented, as I mention the likely high ice year of 1938 and your comments about 2012 exactly reflect the comments I made here in the conclusion.
—— ——–
“However, the conclusion must be that drawn that warming was more widespread in the arctic generally -not just the Atlantic side-than is currently noted in the official sea ice data bases covering1920-1945/50 and that the official records appear to substantially overstate the ice area extent. Some of the thinning of the ice and reduction of glaciers noted today appears to have had their genesis in the period referenced, or earlier.
The 1920-1940’s arctic sea ice melt can therefore be seen as remarkable, albeit the caveats about apples and oranges need to be applied. Looking at the evidence available from each of the arctic oceans means the ice extent probably (but not certainly) lies somewhere within that experienced during the first half of the 2000’s, but was almost certainly not as low as 2007 and 2012, the causes of which are out with the scope of this paper.
We commenced this article with Skeptical Science and the Neven arctic sea ice blog, referencing the Sunday Times article paraphrasing Dr Christy as saying there is ‘anecdotal and other evidence suggesting similar melts from 1938-43 and on other occasions.” The assumption (by this author) being that he is comparing historic data with those of the modern era that commenced in 1979 with satellite measurements.
In that context the ‘similar melts from 1938-43’ seem unlikely, as this short period included a well referenced temporary increase in ice in at least two years, but ‘other occasions’ seems rather plausible. The 1930’s and 40’s were the two warmest consecutive decades in the record according to Professor Phil Jones (measured around Greenland-see reference for context) and there is a considerable body of scientific and anecdotal evidence suggesting the warming was widespread and lasted -with short remissions-for several decades.
No doubt the ‘Back to 1870’ project will objectively look at the available information from all sources and put the period to 1870-and especially 1920-1940/50- into its proper context to today.”
—– —– —-
So I will wish you a Merry Christmas and we will all no doubt look forward to dissecting the results of the labours of Florence and her colleagues with the ‘Back to 1870′ findings.
Tonyb
A couple of recent articles relevant to discussions here.
Greenland
http://www.climatecentral.org/news/greenland-ice-sheet-shifts-melt-18448
Response time to CO2 emissions
http://www.climatecentral.org/news/co2-emissions-peak-heat-18394
Robert Stavins says:
Coverage of 80% to 90% of global emissions can be anticipated
What is the basis for that assertion?
I don’t see how it could be achieved. The EU ETS includes on 45% of EU emissions. If that’s the best the most developed countries in the world can achieve, how can all countries, including the poorest, be expected to achieve 80% to 90%. That would require countries like Ethiopia, Eritrea, Mogadishu and Somalia monitoring and measuring emissions from every cow, sheep and goat to the quality standards that will inevitably be required for legally binding international agreements. It’s clear to all if the measurements aren’t of ISO standards and have low bias and uncertainty. The result will be never ending disputes about who’s cheating.
Repost at end of thread (hopefully)
;
Coverage of 80% to 90% of global emissions can be anticipated
What is the basis for that assertion?
I don’t see how that could be achieved. The EU ETS includes on 45% of EU emissions. If that’s the best the most developed countries in the world can achieve, how can all countries, including the poorest, be expected to achieve 80% to 90%. That would require countries like Ethiopia, Eritrea, Mogadishu and Somalia monitoring and measuring emissions from every cow, sheep and goat to the quality standards that will inevitably be required for legally binding international agreements. It’s clear to all if the measurements aren’t of ISO standards and have low bias and uncertainty. The result will be never ending disputes about who’s cheating.


