Mr. Gates, are you trying to talk logic with psychopaths?
Comment on ‘Warmest year’, ‘pause’, and all that by doug
↧
↧
Comment on ‘Warmest year’, ‘pause’, and all that by SkepticGoneWild
Mosher says:
“Read more comment less”
That is rich, coming from and English major.
↧
Comment on ‘Warmest year’, ‘pause’, and all that by doug
Honestly any ten year old could look at the graphs of the temperature record and see the absurdity of claiming there is a pause. Any ten year old could identify that in about 3 seconds. But adults, ADULTS are pretending not to see that.
↧
Comment on ‘Warmest year’, ‘pause’, and all that by Don Monfort
The clown is on your side, davey. You are so angry you are shooting in all directions.
↧
Comment on ‘Warmest year’, ‘pause’, and all that by doug
Ah, of course, when the data doesn’t add up for you, then you must turn to “the scientists are corrupt”. Grow up.
↧
↧
Comment on ‘Warmest year’, ‘pause’, and all that by Ragnaar
“It seems that maybe when it get warm, the ice melts to cool the planet off?” I am with Mi Cro on this one. Its seems the insulation value of Arctic sea ice would be a greater effect than the albedo effect. The albedo effect of snow on sea ice would protect the sea ice, the insulation, that would help to trap heat in the oceans. When we believe on average the oceans are warming, it would seem logical to vent more ocean heat in the polar regions and that might help explain warmer Arctic atmospheric temperatures. So at least short term oceans trying to cool themselves warm the atmosphere and we think this is an amplification. But the atmosphere is the conduit the oceans use to obtain their own ideal temperatures and we can assume for quite awhile they’ve successfully managed the amount of sea ice rather than been done in by too much or too little sea ice. That life has survived as we bounce from glacial to interglacial and rearrange quite a lot of water to and from ice suggests ice has a stabilizing influence. I’ve also wondered that as CO2 is insulating, how are we separating out its insulation effect from sea ice’s insulating effect? If we lose insulation at the ocean/atmosphere interface, that would look the same as gaining it TOA.
↧
Comment on ‘Warmest year’, ‘pause’, and all that by doug
Are you from TexAssistan too?
↧
Comment on ‘Warmest year’, ‘pause’, and all that by PA
Well, the basic problem is that the global temperature index is basis on historically sparse data that mixes sea surface and land air temperatures (two different measurement). If we had Argos data and measurements from 20 feet deep land probes located in a well distributed manner back to 1880 or earlier the global temperature index would have some sort of value because we would be measuring the temperature of the globe.
Air is a heat exchange medium. Trying to determine if the planet is warming by measuring the air temperature is like trying to determine the temperature of a point in the engine block by measuring coolant temperature at the radiator. Further when the ocean is absorbing heat the air above it is cooler and when it is exhausting heat the air above it is warmer (a contraindication)
Global temperature index is a synthetic construction of dubious practical value.
↧
Comment on ‘Warmest year’, ‘pause’, and all that by curryja
Doug, you are very borderline in your comments. Say something constructive, or at least avoid insulting other commenters
↧
↧
Comment on ‘Warmest year’, ‘pause’, and all that by doug
Nobody believes Judy is that blind.
↧
Comment on ‘Warmest year’, ‘pause’, and all that by doug
jim2, Nah, nah nah, my ears are covered, my eyes shut and my head is in the sand next to the Ostrich. CAN’T HEAR YOU!!!!!
↧
Comment on ‘Warmest year’, ‘pause’, and all that by Peter Lang
Is that statistically significant/ What’s the uncertainty?
How far back does the NOAA data set go? Is the length of the data set sufficient to be significantly significant compared with waves of different periods, such as:
multi decadal ocean currents
ice sheet expansion and retreat
900 year period between Roman, Medieval and current warm period
41,000 year period caused by elliptical orbit around the Sun and the planet’s, tilt, wobble, etc
100,000 year period caused by elliptical orbit around the Sun and the planet’s, tilt, wobble, etc
plate tectonics
solar cycles (of period from decades, centuries, millenia, million years
whatever else
How does the length of NOAA’s dats set compare with these periodicities?
Is it significant?
What’s the uncertainty.
↧
Comment on ‘Warmest year’, ‘pause’, and all that by Don Monfort
You don’t know what I think, jimmy. But I understand what you are saying. No matter what happens it’s part of the AGW theory. Just add a ‘likewise’ in there somewhere and there is no inconsistency with the theory, no matter how silly and disingenuous you look saying it. The AGW theory is not falsifiable. You have no credibility, jimmy. Give it up.
↧
↧
Comment on Week in review by Joseph
i think the link below is relevant and makes me ask why don’t we wait until they start developing the land they already have instead of just leasing more land half of which they don’t even use? I think it is also important to note that the private sector and states are doing a good job of increasing production
http://www.facethefactsusa.org/facts/letting-sleeping-oil-deposits-lie
More than half the federally owned land approved for oil exploration and leased to energy firms for that purpose is going unexploited – because the companies holding the rights say it would be economically infeasible.
175 billion barrels of oil lie under federally owned land. 70 percent of that land has been approved for exploration and drilling. But 56 percent of it goes untapped. Offshore exploration is even more modest, with 72 percent of the area leased to energy interests not producing oil.
The Congressional Budget Office says the leaseholders are waiting until oil production becomes more profitable.
↧
Comment on Week in review by Rud Istvan
Jim D, I agree. Moncktons assertion that f must be less than 0.1 for stability is simply wrong. He was overzealous in rejecting the Bode feedback model as useful. His own figure 5 shows that anything up to the inflection (~0.75) is still well behaved and ‘stable’. The implicit AR4 f is 0.65 if you accept that the grey earth SB zero feedback value is 1.2C. Certainly on the quasi linear flat part of the Bode feedback model used by Lindzen himself in testmony to the UK parliament, anything below 0.5 is stable. It is still a well damped system. That why I took Momckton to task (politely and factually) over at WUWT yesterday on the model thread. It is why I rederived r and f above here and over there, to test the model against more reasonable values for those two parameters. Results foot neatly to a lot of other literature.
And Monckton was pleased that I did so, since that sort of independent testing that anyone can do with such a simple equation, plus bounding the 5 parameters using only IPCC info, was the whole point of his paper. He said so himself on that thread.
BTW, there is blogosphere confusion about what climate feedback means. It is a change in a secondary feedback in response to a change in primary CO2 forcing. So it is actually a ‘second derivative’, not a ‘first derivative’. For the math challenged, a simple illustration. Clouds form as a result of land plant transpiration and water vapor evaporation from (mainly) oceans at our range of Earth temperatures. No one doubts that clouds provide negative climate feedback; they are the main component of albedo. But the IPCC assertion that clouds have positive feedback to increased CO2 forcing (itself a rate of change) means that this negative cloud feedback weakens (becomes less negative) as CO2 increases. See essay Cloudy Clouds for specifics from AR4 and AR5. That is a ‘second derivative’, changing the rate of change in cloud response. Never confuse speed with acceleration, as some have with this general feedback notion, both warmunist and skeptical.
↧
Comment on Week in review by Peter Lang
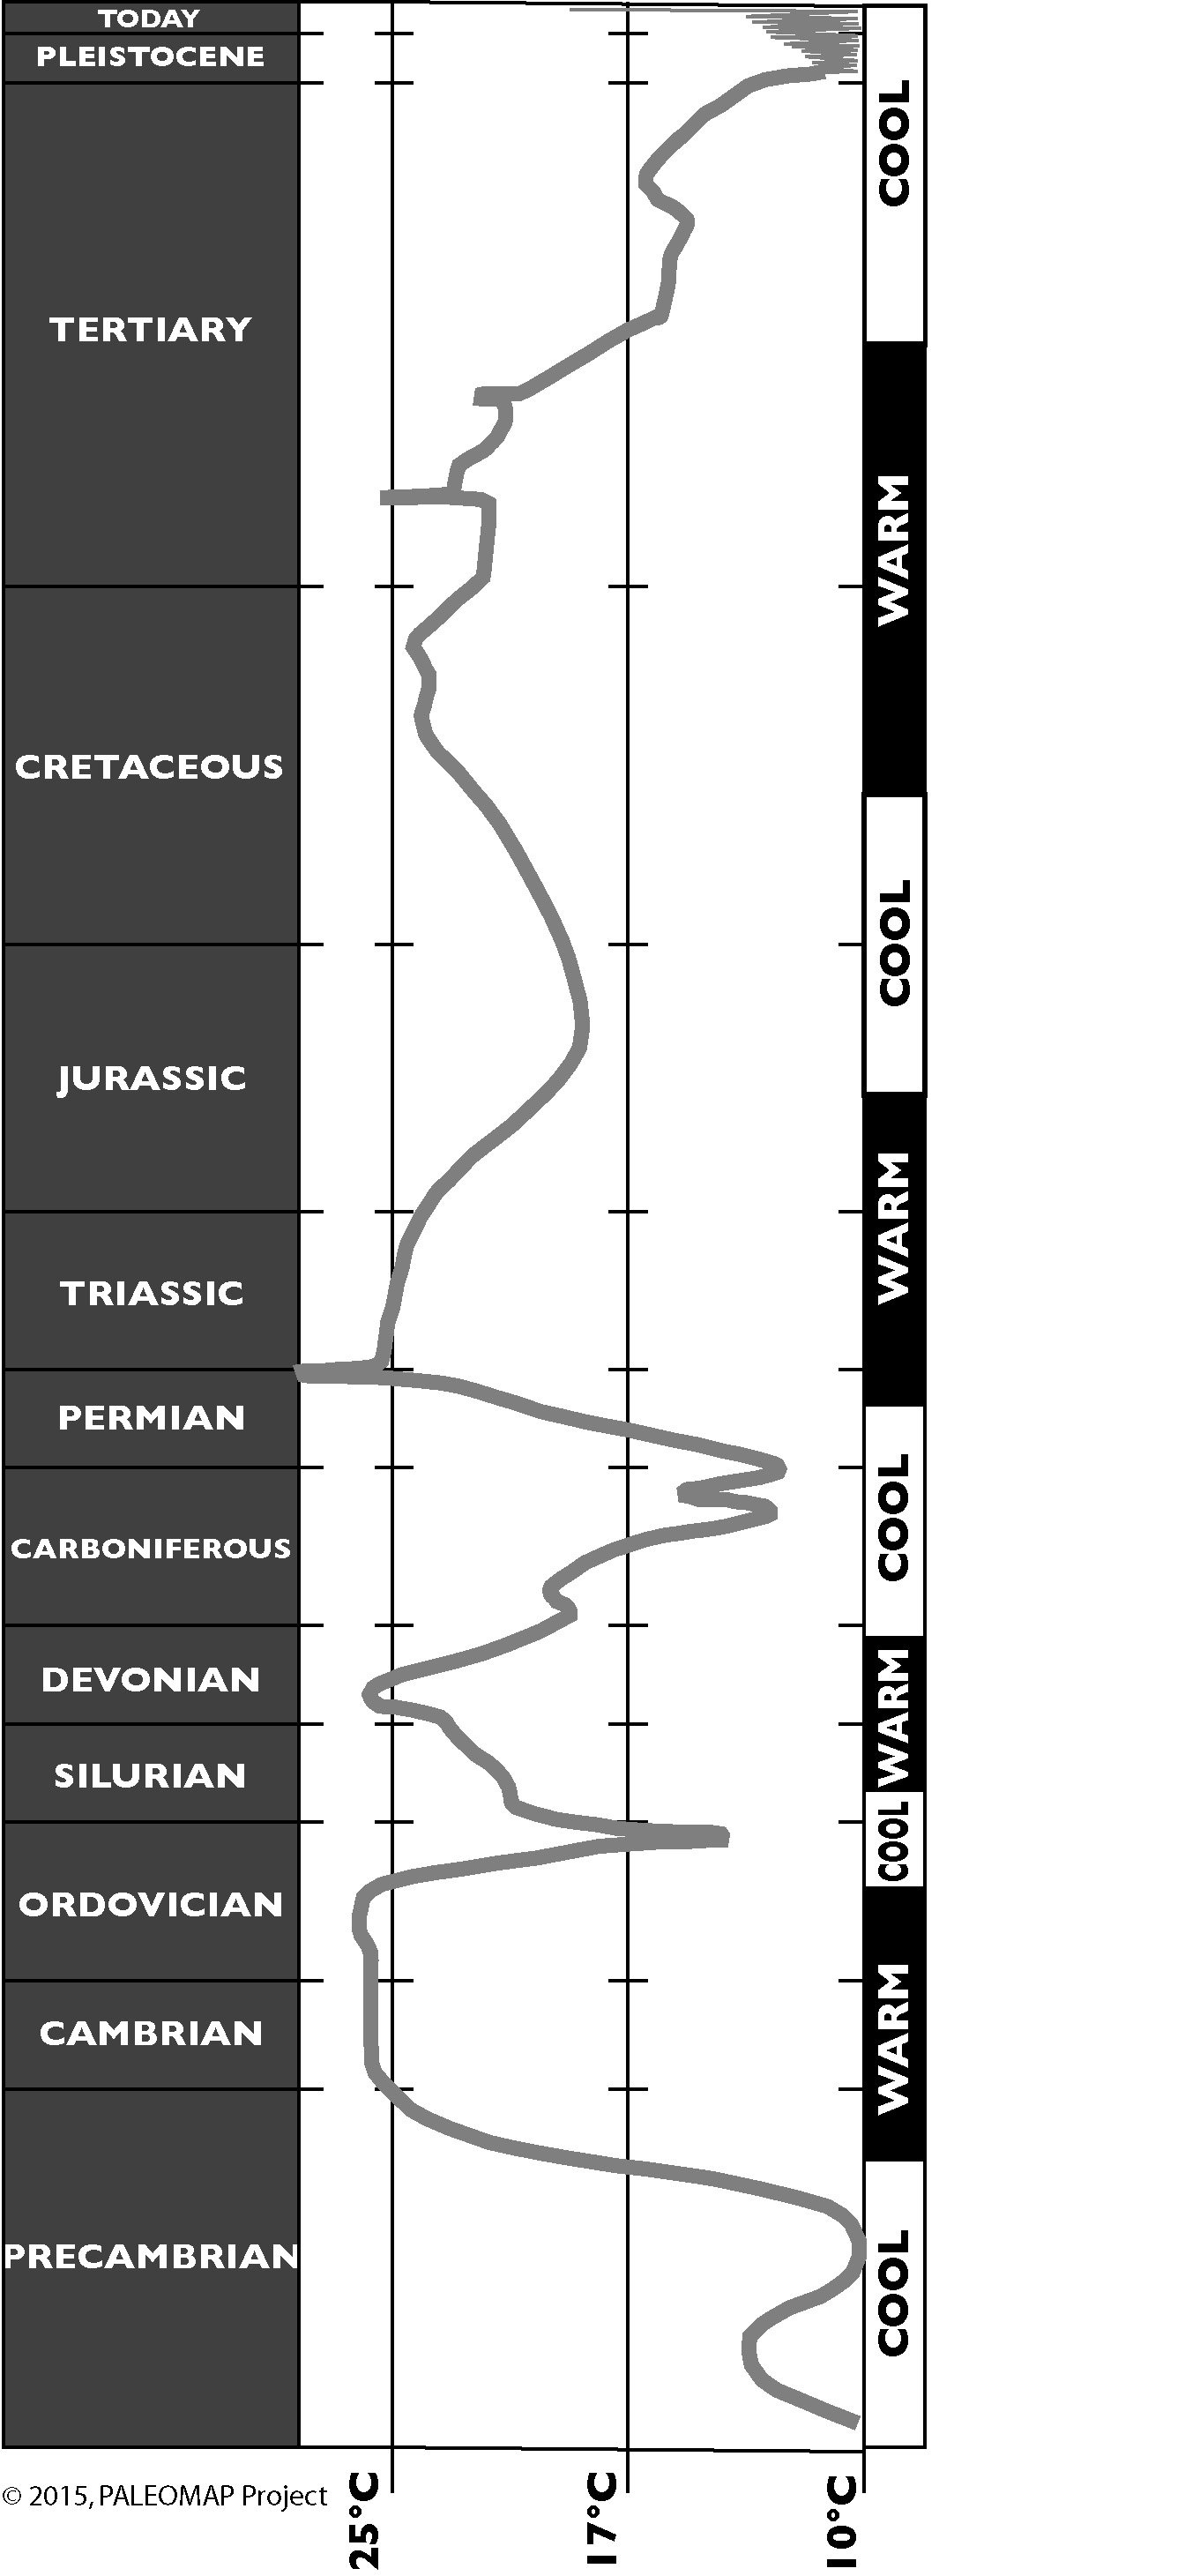
Jim2,
There’s much finer detail in the charts now, but the big picture message hasn’t changed much in the past 50 years or so. Here’s is a chart from Scotese that is consistent with what I learnt way back at the beginning of time.
http://www.scotese.com/climate.htm
↧
Comment on ‘Warmest year’, ‘pause’, and all that by Jim D
AK, his graph did not demonstrate decreasing upper tropospheric water vapor. Without actual evidence, this would be handwaving. I have heard that the relative humidity may decrease, but not the water vapor itself.
↧
↧
Comment on ‘Warmest year’, ‘pause’, and all that by bob droege
What Don,
Did you think it would take more than 5 minutes
http://www.ncdc.noaa.gov/bams-state-of-the-climate/2009-time-series/humidity
http://woodfortrees.org/plot/esrl-co2/from:1970/to:2009/trend
http://woodfortrees.org/plot/wti/from:1970/to:2009/trend
Shows water vapor up, temperature up and CO2 up.
↧
Comment on Week in review by JCH
The Saudis are heavily invested in the majors, and they work well with them. There are all kinds of rumors circulating about majors buying out shale companies. They don’t do drill baby drill. They want control of the supply. There will be blood.
↧
Comment on Week in review by Curious George
Jim D – an excellent point. I don’t know either. But maybe poor people tend not to migrate to cold areas. Better ideas welcome.
↧
More Pages to Explore .....


