<a href="https://marine.rutgers.edu/pubs/private/Science-2015-Dutton-.pdf" rel="nofollow">Some "alarmist" science not written by James E. Hansen: looks like at least 6 meters.</a>
Comment on Week in review – science edition by JCH
↧
↧
Comment on Week in review – science edition by Joel Williams
Is your prediction the same as the SL rise on the graph you presented?
↧
Comment on Risk assessment: What is the plausible ‘worst scenario’ for climate change? by Vaughan Pratt
@PA: From what I can tell the UHI is significant and about the same order as the CO2 forcing.
As Hansen, Russell, Lacis et al pointed out in 1985, the oceans are taking up most of the heat resulting from CO2 forcing.
So in order to understand the impact of UHI it makes sense to look at the three trend lines of HadSST3 (sea surface temperature) before, during, and after the hiatus, as shown here.

The hiatus in the middle, covering the decade 2001-2011, is clearly visible
Before it there is a dramatic rise in sea surface temperature.
After it there is an even more dramatic rise.
This UHI you speak of is presumably from activity in the Lost City of Atlantis, which after great hyperactivity prior to 2001 would appear to have gone dormant for a decade, then revived at an even higher level of hyperactivity.
If you have yet more details about Atlantis, a huge audience out there awaits you. Asking a million dollars for an article on what you know about Atlantis would be short-changing yourself.
↧
Comment on Pre-traumatic stress syndrome: climate scientists speak out by Punksta
Camille Parmesan <i>It’s not just been climate change, there’s a growing, ever-stronger antiscience sentiment in the U. S. A. </i>
"Anti <b>junk</b>-science" she ought to have said of course. The ongoing exposure of which is the source of many climate scientists' traumas, her own included.
↧
Comment on Week in review – science edition by JCH
People who think SLR will be nonlinear cannot make predictions on 2100.
There is no means for doing so.
In the past in similar conditions they seem to agree SLR increased by 6 meters and up.
↧
↧
Comment on Risk assessment: What is the plausible ‘worst scenario’ for climate change? by Vaughan Pratt
HAS: <I>It would be more practical and logical to define it as what it is.</I>
Indeed. It is what it is.
This tautology is nicely summarized <a href="https://en.wikipedia.org/wiki/It_Is_What_It_Is" rel="nofollow">here</a> as
<i>This is commonly used in American culture as an apathetic response to something that makes little sense or has little to no validity.</I>
Not a bad analysis of RCP8.5.
↧
Comment on Week in review – science edition by Joel Williams
Are you going with 6+ meters or the 1 meter IPCC prediction? It is not a question about what other people think/believe. I have indicated what I believe on Climate, Etc and in my posting on the web. Since you are giving out plots, etc, and thus, presumably, indicate that you are top of it all to data/scenarios/etc, I am asking what you think it will be.
↧
Comment on The Siddhartha heuristic by Punksta
<i>The climate change alarm is further motivated by building political will to act on reducing emissions.</i>
Mainly motivated by ideological desire to justify more taxatiion and political action, any old excuse gladly accepted ?
↧
Comment on Week in review – science edition by Joel Williams
JCH,
I’ll check for your 6+ or 1 meter answer in the morning, so yo have plenty of time to decide. I’m off to get a good night’s sleep.
↧
↧
Comment on Week in review – science edition by PA
As aside in general your map looks wrong.
This is what I would expect (another post 1950 map).
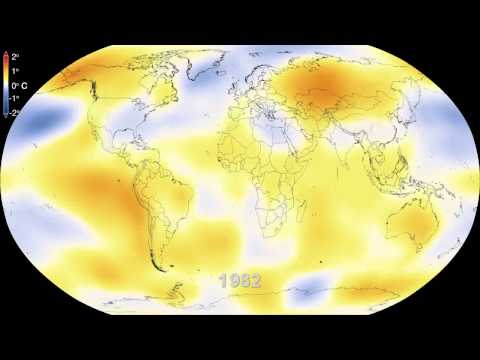
Perhaps someone can explain why these maps don’t show urban hot spots. Is it lack of resolution or homogenization or something else.
The DC area show glow on a real map of post 1950 temperature change.
↧
Comment on Week in review – science edition by JCH
I think it is going to be nonlinear.
↧
Comment on Risk assessment: What is the plausible ‘worst scenario’ for climate change? by HAS
VP on tautologies.
Fortunately as should be obvious I am not of American culture and know the difference between the content rich process of applying a meaningful label to a term (call it what it is) and asserting tautologies (“it is what it is”).
To say that RCP8.5 is the upper bound of RCP scenarios contains information.
Saying:
“If ‘business as usual’ is ‘continued exponential growth of excess CO2′, RCP8.5 is ‘business as usual’, therefore RCP8.5 is ‘continued exponential growth of excess CO2′” is a tautology and therefore content free.
Just like your arguments above that I labelled “ham and eggs”.
Now there’s a tautology for you.
↧
Comment on Week in review – science edition by beththeserf
Hard ter measure the impact of melting ice when it
doesn’t melt… Deja vu all over agin. Last Wednesday,
ice breaker research vessel CCGS Amundsen on its
way ter Hudson Bay re-routed ter rescue ships stuck
in ice..
Hard ter measure melting ice when yer stuck in it.
December, 2013, Chris Turney Climate Change
Expedition stuck in ice in the Antarctic.
http://www.abc.net.au/news/2014-01-06/leader-of-ill-fated-antarctic-voyage-defends-trip/5185666
↧
↧
Comment on Week in review – science edition by mosomoso
Interesting that Mawson didn’t have any parking problems in Commonwealth Bay.
↧
Comment on Week in review – science edition by beththeserf
Would yr care ter elaborate, moso?
↧
Comment on Week in review – science edition by jhborn
"Why this proves short CO2 lifetime"
That refers to the Gösta Pettersson paper from a couple of years ago. When Dr. Pettersson gave the blog-post <a href="http://wattsupwiththat.com/2013/07/01/the-bombtest-curve-and-its-implications-for-atmospheric-carbon-dioxide-residency-time/" / rel="nofollow">version</a>, his conclusion was disputed in comments from <a href="http://wattsupwiththat.com/2013/07/01/the-bombtest-curve-and-its-implications-for-atmospheric-carbon-dioxide-residency-time/#comment-1352230" rel="nofollow">Ferdinand Engelbeen</a>, <a href="http://wattsupwiththat.com/2013/07/01/the-bombtest-curve-and-its-implications-for-atmospheric-carbon-dioxide-residency-time/#comment-1352086" rel="nofollow">Willis Eschenbach</a>, and others.
Christopher Monckton then penned a <a href="http://wattsupwiththat.com/2013/11/21/on-co2-residence-times-the-chicken-or-the-egg/" / rel="nofollow">post</a> in which he championed Dr. Petterson's position. Since the ensuing discussion became rather confused, I wrote a <a href="http://wattsupwiththat.com/2013/12/11/co2-residence-times-take-two/" / rel="nofollow">post</a> setting forth the mathematical bases for both sides.
My Fig. 2 depicted the model on which Petterson's position was based, and my Fig. 1 depicted what I saw as the opponents' model. Viewed in light of my post and in particular my Fig. 2, what I consider the best explanation is Ferdinand Engelbeen's first <a href="http://wattsupwiththat.com/2013/12/11/co2-residence-times-take-two/#comment-1498540" rel="nofollow">comment</a> in response. I commend that comment and those of his that followed to the attention of anyone interested in the issue.
↧
Comment on Week in review – science edition by opluso
The latest Stern look:
The two defining challenges of this century are overcoming poverty and managing climate change.
It’s comforting to know that we’ve eliminate war for the rest of this century…
↧
↧
Comment on Week in review – science edition by mosomoso
I’m just sayin’ that Mawson got about better than Turney. Maybe there was less ice back then, or maybe Mawson wasn’t so surprised by ice in the Antarctic.
For once I’ll quote Wiki. From their list of Antarctic expeditions:
‘2013−14 — Chris Turney led an expedition, entitled “Spirit of Mawson”, aimed at highlighting the decline in sea ice due to climate change. The expedition was abandoned when its Russian ship became stuck in unusually large amounts of sea ice.’
Giggle.
↧
Comment on Week in review – science edition by opluso
Jim D:
It is always disappointing to me to see temp anomalies estimated with 1200 km Hansen and then mapped to a Robinson projection. Though I suppose it has the intended effect.
https://www.ncl.ucar.edu/Document/Graphics/map_projections.shtml
PA:
Anomaly temps are not measured directly (unlike UHI). They are calculated in reference to a long-term climatology (typically 30 years).
By utilizing 1200 km infill (or even 300 km infill, which is more defensible on a global scale), urban heat can infuence anomaly calculations over large areas (and vice versa). The most I would expect to see on a global anomaly map would be a widely dispersed residual influence, depending on the grid scale.
↧
Comment on Week in review – science edition by opluso
“1200 km Hansen” should be “1200 km Hansen correlation”.
↧


