Jim D, you have identified a non-MDV spline in GISTEMP that passes through 2015. Similar exists in HadCRUT4.
The spline is central to this sequence:
1895 – neutral
1910 – MDV maximum negative (-ve)
1925 – neutral
1940 – MDV maximum positive (+ve)
1955 – neutral
1970 – MDV maximum negative (-ve)
1985 – neutral
2000 – MDV maximum positive (+ve)
2015 – neutral
2030 – MDV maximum negative (-ve)
This is in respect to HadCRUT4: http://www.woodfortrees.org/plot/hadcrut4gl
Now see relevant model mean vs observations comparisons:
IPCC AR5 WGI Figure 10.1 (a)

Model mean vs GMST (HadCRUT4)
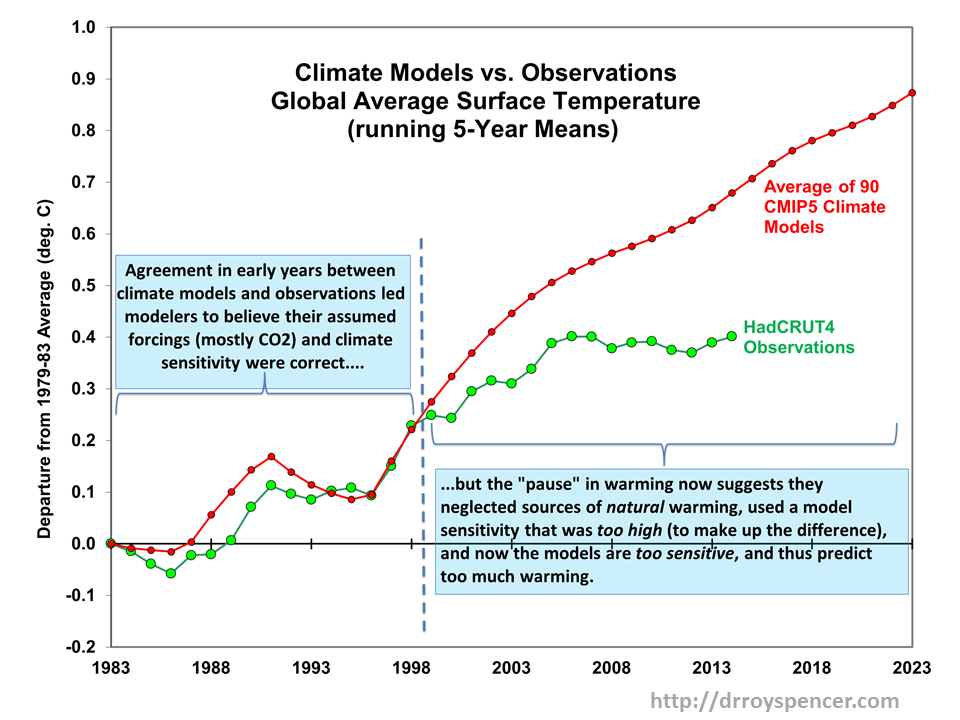
Model mean trajectory:
1895 – from below (Yes, valid)
1925 – from above (Yes, valid)
1955 – from below (Yes, valid)
1985 – from above (No, invalid)
2015 – from below (No, invalid)
Obviously the CO2-forced model mean does not pass through the MDV-neutral spline after 1955, the trajectory becomes much steeper. This is highly problematic. It implies that CO2 does not drive the secular trend in GMST after MDV is removed.
More in page 2 of comments at Climate Conversations Group:
http://www.climateconversation.wordshine.co.nz/2015/08/fatal-deficiencies-destroy-scientific-case-for-climate-catastrophe


