BTW, Jim and JCH, I am on your side; I’m for alternative energy research, I support the green energy tax credit, I am for conservation, and I even cut down on meat. I am also for protecting science from humanity’s natural desire to evangelize faiths. Science serves us well if we protect it.
Comment on Politics of climate expertise by Ron Graf
↧
↧
Comment on Politics of climate expertise by Ron Graf
JCH, and if we don’t reach 700ppm, you and Jim can take the credit. I think the better road to get there is to encourage STEM education without politics mixed in.
↧
Comment on Politics of climate expertise by Jim D
Ron, as I have said, CO2 was not a dominant forcing before 1900, and there was no warming trend until after that. Many say that the LIA corresponded to lower solar activity that happened a couple of times in the 18th and 19th centuries. Do you not make that association? I have mentioned solar activity before in connection with the 20th century lull and rise before 1950 and today’s lull, and would not discount it so easily as a factor in the lowest parts of the LIA.
Are you saying you don’t think the Holocene Optimum really was warmer than most of the time since? I am not sure whose data you are using on that one. Show me what you are talking about.
You are saying the recovery started around 1650, but many would claim the LIA lasted into the 19th century, and only ended thereafter. You can use PAGES2k for example.

On Milankovitch, I think you are saying that you don’t see that the cooling since the Holocene Optimum, which you appear to dispute, could be due to the precession cycle now favoring the northern hemisphere ice, but first you have to show me why you think the Holocene Optimum warm period wasn’t.
Why would one hemisphere’s warm period be canceled by the other’s cooling you ask. The answer is the energy balance and the heat content budget. While the albedo and other forcing stays fixed, it is true that the mean surface temperature can’t change spontaneously, but it can be redistributed, e.g. by changing ocean currents. The ocean itself can’t generate heat content. If the heat content is changing, so is the net forcing. Fluctuations can exist, e.g. with ENSO cycles, but these are damped by a radiative balance that acts as a restoring force to the equilibrium GMST.
OK, you can knock the older IPCC projections. See if I care. They still did better than the people with the low-ball sensitivity guesses in the no-feedback range. The official IPCC projections don’t rely entirely on models, but factor in other judgments too. I pointed out that it only takes a moderate transient sensitivity of 2 C per doubling to explain the warming since 1950.
With the CO2 change being dominant already at 400 ppm, especially if we go on to reach 700 ppm, it will be even more dominant, so I am not sure what you are getting at with the last part. Those factors add tenths, while CO2 is adding whole degrees. It’s relatively large compared to those other factors now and in the future relatively even larger.
↧
Comment on Politics of climate expertise by Robert I. Ellison
“The climate system has jumped from one mode of operation to another in the past. We are trying to understand how the earth’s climate system is engineered, so we can understand what it takes to trigger mode switches. Until we do, we cannot make good predictions about future climate change…” Wally Broecker
Orbital changes make no difference at all to global energy dynamics. What changes is nonlinear internal responses in AMOC, meridional or zonal wind fields at the poles, upwelling at the western margins of continents, rainfall, vegetation, dust and cloud. It makes Earth system science quite a lot less simple but more interesting than narratives about forcing. But if you are going to rabbit on about it – start with CMIP5 forcings.

https://data.giss.nasa.gov/modelforce/
Natural forcing is of course negligible. But negligible forcing drives large responses in the Earth system.
“Technically, an abrupt climate change occurs when the climate system is forced to cross some threshold, triggering a transition to a new state at a rate determined by the climate system itself and faster than the cause. Chaotic processes in the climate system may allow the cause of such an abrupt climate change to be undetectably small.” NAS 2002
Even at this short time frame – climate has shifted 4 times. Around 1912, 1944, 1976 and 1998. “Global-scale multidecadal variability missing in state-of-the-art climate models” – https://www.nature.com/articles/s41612-018-0044-6
That caused some 50% of warming in the last 40 years – and most of the early century warming. Where it shifts next is the question.
↧
Comment on Week in review – science edition by Ragnaar
‘How to make the world better. Really. With Dr. Bjorn Lomborg’ – New video. Peterson interviews him. Climate change is around 25:00. Lomborg make a good argument.
↧
↧
Comment on Politics of climate expertise by Robert I. Ellison
Higher cosmic ray intensity is lower TSI. But because the sun is so stable you need to look for amplifying mechanisms in the Earth system to explain large climate variability.

https://www.pnas.org/content/109/16/5967
Narrative nonsense about precession in the interminable and strange unscience thread way above is just that.
↧
Comment on CAGW: a ‘snarl’ word? by kizzi40
Thought I’d chip in here as I was the Quoran who asked the question (and received a lot a personal criticism in the reply).
I originally used the term CAGW in an earlier answer to a Quora question from a naive standpoint. I had read the term before somewhere and didn’t know it was pejorative. Apparently, it’s not when used as a noun as in “The coming AGW catastrophe” but it is a no-no if used as an adjective as I used it with “Catastrophic AGW”. Not appreciating these mores I got criticised totally unexpectedly, so I asked on Quora about it. JC’s thoughts are very thorough.
That exchange was an eye-opener. I hadn’t really grasped before the rhetorical devices used when discussing climate science.
↧
Comment on Special Report on Sea Level Rise by Atomsk's Sanakan (@AtomsksSanakan)
Re: “I’ve made my projection – global surface temperatures will remain mostly flat for at least another decade.”
Wrong link for that. Should be:
https://judithcurry.com/2015/01/16/warmest-year-pause-and-all-that/
↧
Comment on Politics of climate expertise by owenvsthegenius
I think I can help you Jim. ECS is an open question. Estimates begin with assumptions about feedbacks, forcing and interactions. Since ECS estimates vary significantly, and since there exists an accepted range of estimates, it may seem wise to settle on a number. It may seem wise to accept a mean of estimates or it may seem wise to settle on a number which pleases the majority. But neither of these seemingly wise choices are particularly scientific approaches.
But here we have the appeal for consensus. The numbers have us a bit ahead so it must be true, like they do it on Survivor. If you’re on the bottom we vote your hypothesis out. But that’s not right Jim.
You make scads of assumptions which you feel very strongly must be true and so you defend you points. But so many of your assumptions have failed validation. Cloud and water vapor feedbacks come to mind. Your fallacious claims that a warming, carbon rich world will somehow overwhelm plant and animal life. Your rejection of the clear benefits of carbon seeding. Etc.
But you’re not alone, many seemingly good scientists make the same mistake.
I listened to a Trenberth talk earlier and he outlined the “very real” possibility that a warming world would produce increased drought as well as increased precipitation. And with adaptation on the menu I found myself thinking, ” even if the data supported all of Trenberth’s suggestions, so what.” The benefits of carbon seeding and a warming world easily eclipse the potential threats. And a cursory look at drought data will satisfy anybody that Trenberth should modified his tone. But in his favour, he does portray the uncertainties. You don’t really do that so much.
It might be good to close your eyes for a moment and imagine a world free of Anthropogenic CO2; this world fluctuates in temperature. And according to proxies, this last interglacial experienced periods of wild fluctuations. Wilder than today, if you can imagine it. This is why we test hypothesis. Because natural variability can still explain everything.
You can open your eyes now.
Assuming that you can definitely derive ECS from the temp record by considering SI and adding the Aerosol offset, while comparing the pre industrial trajectory with post industrial acceleration, mining the data for the difference and poof ECS. That’s also an assumption. No scientific facts to be found anywhere. And you are completely unaware of the natural internal forcing which may account for the very same global mean.
This highlights your error in reasoning. Natural variability best explains our current conditions, and you may add radiative forcing as it seems to exist.
↧
↧
Comment on Politics of climate expertise by owenvsthegenius
I can claim to have a first hand accounting of Brad’s claim. Seen it in the wild, Willard. I hope that counts.
↧
Comment on Politics of climate expertise by owenvsthegenius
You said that well, Robert. Thank you.
↧
Comment on Politics of climate expertise by owenvsthegenius
It’s my opinion that Jim will not let go of the bone. Consensus is needed at all costs. He will go down with his ship and start breathing the water.
↧
Comment on Climate sensitivity to cumulative carbon emissions by Robert I. Ellison
The origin of sensitive dependence?
“Perhaps we can visualize the day when all of the relevant physical principles will be perfectly known. It may then still not be possible to express these principles as mathematical equations which can be solved by digital computers. We may believe, for example, that the motion of the unsaturated portion of the atmosphere is governed by the Navier–Stokes equations, but to use these equations properly we should have to describe each turbulent eddy—a task far beyond the capacity of the largest computer. We must therefore express the pertinent statistical properties of turbulent eddies as functions of the larger-scale motions. We do not yet know how to do this, nor have we proven that the desired functions exist.” Lorenz E. N.. 1969 Three approaches to atmospheric predictability. Bull. Am. Met. Soc. 50, 345-351.
50 years later – and the problems remain.
“Sensitive dependence and structural instability are humbling twin properties for chaotic dynamical systems, indicating limits about which kinds of questions are theoretically answerable. They echo other famous limitations on scientist’s expectations, namely the undecidability of some propositions within axiomatic mathematical systems (Gödel’s theorem) and the uncomputability of some algorithms due to excessive size of the calculation.” James McWilliams
If you recognize the form – you should be able to recognize the substance.
↧
↧
Comment on Climate sensitivity to cumulative carbon emissions by Robert I. Ellison
And equilibrium in this context is a radiative balance at toa – as transient as that is – rather than thermodynamic equilibrium.
↧
Comment on Climate sensitivity to cumulative carbon emissions by matthewrmarler
coolclimateinfo: <i>When will people get it that it is the ocean outgassing via Henry’s Law that is responsible for driving the accumulation of CO2, via a solar-warmed ocean? </i>
Cool graph. Has ocean pH been increasing (ocean CO2 concentration decreasing) during that half century?
↧
Comment on Climate sensitivity to cumulative carbon emissions by coolclimateinfo
thanx. Good question. CO2 is also used for plant food undersea right? So maybe the ocean florea greened from CO2 too as has land flora.
↧
Comment on Politics of climate expertise by Jim D
Do those proxies change the hockey stick? No, they have not shown that nor even said that. That’s your own assumption on the basis of no supporting facts.
↧
↧
Comment on Special Report on Sea Level Rise by daveburton
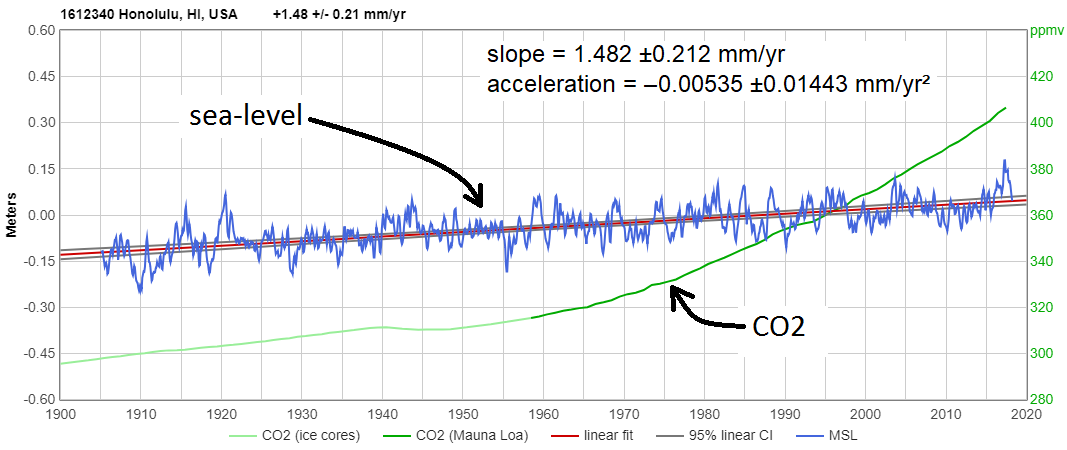
I wrote, “Temperatures have been rising, too, with fits and starts, for about forty years. Yet there still has been no acceleration in the rate of sea-level rise.”
Atomsk’s Sanakan replied, “You’re simply repeating the same claims that have been debunked in the scientific literature for years.”
Wrong. The measurements tell the story. All the best-quality, long coastal measurement records show the same lack of significant sea-level rise acceleration, for at least ninety years (and in most cases even longer).
Every long, high-quality sea-level measurement record shows that the rise in CO2 and other GHG levels has caused no significant acceleration in sea-level rise:
https://sealevel.info/MSL_global_thumbnails5.html
How is this unclear to you?
Atomsk’s Sanakan continued, “Sea level rise results from melting land ice and thermal expansion of water.”
True.
Atomsk’s Sanakan continued, “Warming causes thermal expansion and land ice melt.”
Sometimes. Melting obviously only occurs when temperatures rise above 0°C. If temperatures stay below 0°C, warming can cause increased snowfall, and no melting at all.
Atomsk’s Sanakan continued, “Thus, one would expect warming to increase the rate of sea level rise.”
Not necessarily. Why do you ignore snowfall? I wrote a dozen paragraphs, explaining how a warming climate can increase snowfall accumulation on ice sheets and glaciers, and thus cancel the effects of melting and thermal expansion. Snowfall accumulation has more effect on coastal sea-level than any of the factors which increase sea-level. But you ignored it.
I wrote:
a warming climate has effects which both increase and decrease sea-level trends, and it seems that (at least when there’s no Laurentide ice sheet to melt!) those processes roughly balance each other.
The only effects that many climate alarmists seem to be aware of are those which increase sea-level, like ice melting, sublimation, thermal expansion, and glacier calving. But the most important process which affects ice sheet mass is none of those things. It is snowfall.
A warming climate increases snow accumulation on ice sheets and glaciers — and thus decreases sea-level — in two ways:
1. Most obviously, warmer air holds more moisture. Every 1°C of warming increases the amount of moisture which the atmosphere can hold by about 7%.
When temperatures are very low snowfall is greatly reduced, because the frigid air carries very little moisture; it is said to be “too cold to snow (much).” The heaviest snowfalls usually occur when temperatures are only modestly below freezing.
2. Decreased polar sea ice coverage (Arctic, North Atlantic, and Southern Ocean) increases water evaporation, which increases “lake/ocean-effect snowfall” (LOES) downwind. Some of that snow falls on the ice sheets and glaciers, increasing ice accumulation, and offsetting meltwater losses. Other snow falls on land, increasing snowpack.
Snowfall is, by far, the most important factor in ice sheet & glacier mass fluxes. Increased snowfall is the main reason that, for the second glaciological year in a row, the Greenland Ice Sheet (which usually loses ice) apparently had no net loss of ice.
Yet in eighty pages of fine print, which you can read here…
https://www.ipcc.ch/pdf/assessment-report/ar5/wg1/WG1AR5_Chapter13_FINAL.pdf
…the IPCC’s AR5 authors never even mentioned lake/ocean-effect snowfall, and its effect on ice sheet & glacier mass balance, and sea-level. It appears that they had never heard of it.That amazes me. Any competent meteorologist could have told them all about lake/ocean-effect snowfall. It’s the reason Buffalo, New York famously gets so much snow. But the IPCC’s sea-level authors seem to have been unaware of it.
In both Greenland and Antarctica, snowfall is the most important factor affecting ice sheet mass balance, greater in magnitude than melting, sublimation, or iceberg calving. In fact, in Antarctica, snowfall accumulation is approximately equal to the sum of those other three factors.
Multiple studies have found that snowfall accumulation in Antarctica has been increasing.[1][2][3][4]
The magnitude of ice accretion from snowfall on ice sheets was illustrated by the amazing story of Glacier Girl. She’s a Lockheed P-38 Lightning which was extracted in pieces from beneath 268 feet(!) of accumulated ice and snow (mostly ice), fifty years after she made an emergency landing on the Greenland Ice Sheet.
That’s more than 5 feet of ice per year, which is equivalent to more than seventy (70) feet of annual snowfall, which had piled up on top of the airplane! That snow represents evaporated water, mostly removed from the Arctic and North Atlantic Oceans, which then fell as ocean-effect snow on the Greenland Ice Sheet.
We know that some of the effects of global warming increase sea-level, and others decrease it. Forty years of experience tell us that those factors roughly cancel each other, meaning that there’s no reason to expect significantly accelerated sea-level rise from mankind’s GHG emissions.
Atomsk’s Sanakan wrote, “Other papers confirm the increased post-1990 rate of sea level rise shown in some of the above papers; this increased post-1990 rate is greater than the rate during the mid-20th century. The other papers also show that sea level rise acceleration post-1990, predominately due to increased land ice melt …
“Global sea-level budget 1993–present” …
“Evaluation of the global mean sea level budget between 1993 and 2014” …
“The increasing rate of global mean sea-level rise during 1993–2014”
“Unabated global mean sea-level rise over the satellite altimeter era” …
Not “post-1990.” Post-1993.
What do you think happened in 1993? That’s the start of mid-ocean sea-level measurements by satellite altimetry.
Sea-level trends vary from one location to another. So if you splice together graphs of sea-level measurements from different places, you can easily create the appearance of acceleration (or deceleration). Splicing a post-1993 satellite altimetry graph onto pre-1993 coastal tide gauge graph is what Tony Heller memorably called the “IPCC sea-level Nature trick.”
Atomsk’s Sanakan wrote, “Climate-change–driven accelerated sea-level rise detected in the altimeter era”
That’s Nerem et al 2018, which is a great example illustrating the malleability and untrustworthiness of the satellite altimetry data. He claimed to have discovered a heretofore unnoticed “acceleration” in the satellite altimetry measurement record of sea-level. But he did it by reducing the rate of measured sea-level rise in 20 year-old Topex-Poseidon data, thereby making more recent measurements appear to have accelerated, by comparison:

(BTW, that drastic revision of the Topex-Poseidon rate also lowered the average rate from the previously reported 3.4 mm/yr to the currently claimed 3.1 mm/yr.)
Nerem completely ignored the coastal tide gauge measurements. Given the high quality and long duration of coastal measurements, and the low quality and short duration of the satellite measurements, why would anyone ignore the former in favor of the latter? That’s not just cherry-picking, it’s picking the rotten, wormy cherries!

When people do that it’s a sign of bias: picking studies which confirm their prejudices, and ignoring contrary evidence. You see the same sort of behavior when people cite GRACE studies and ignore ICESat & ERS, w/r/t Antarctica ice mass balance.
That sort of behavior is useful — for identifying scientific work which you shouldn’t trust.
Atomsk’s Sanakan wrote, “Ice melt in warm months exceeds ice accumulation in cold months, leading to net melt of ice that contributes to sea level rise.”
There are no “warm months” in Antarctica. Temperatures there average more than forty degrees below zero. A few degrees of warming obviously cannot melt that. Only where the ice is grounded below sea-level, and is in contact with the ocean, is significant melting even possible, and that’s affected more by ocean currents than air temperatures.
Greenland does experience seasonal melting, but even there snowfall accumulation routinely exceeds ice mass loss through surface melting & sublimation.
In most years, the additional ice loss through iceberg calving results in a small net loss of ice, averaging about 200 Gt (sufficient to cause a negligible 0.022 inches of sea-level rise). But in both of the last two glaciological years years increased snowfall has meant that Greenland had no net ice loss at all. I wrote about it here:
Atomsk’s Sanakan wrote, “The following video will simplify this down to a laymen’s level for you, in case you’ve fallen for the distortions of people like Paul Homewood and Christopher Booker:” {links to a 1.5 year old potholer video}
“Potholer” — that’s your source? Good grief, you CAN’T be serious!
If you really think that potholer (Mr. Peter Hadfield) is trustworthy, and Homewood & Booker aren’t, you are very, very confused. Hadfield is a disinformation source.
Hadfield specializes and character assassination and straw-man argumentation. A tl;dr paraphrase of his typical tedious attack is, “look how stupid {Alex Jones, or Ray Comfort, or someone equally irrelevant} is, ergo we can dismiss everyone skeptical of climate alarmism.”
For instance, if you believed his ridiculous Climategate video you’d think the worst scientific scandal since Piltdown Man was much ado about nothing. Here’s the truth:
↧
Comment on Climate sensitivity to cumulative carbon emissions by Ragnaar
https://wattsupwiththat.com/2017/05/13/is-murry-salby-right/
Istvan explains it. I think your point is a dead end.
↧
Comment on Politics of climate expertise by Jim D
owen, I am not sure what all this is, but is your bottom line that you’re looking forwards to a 700 ppm world? If so, why so? If not, why not?
↧
More Pages to Explore .....


